Introduction
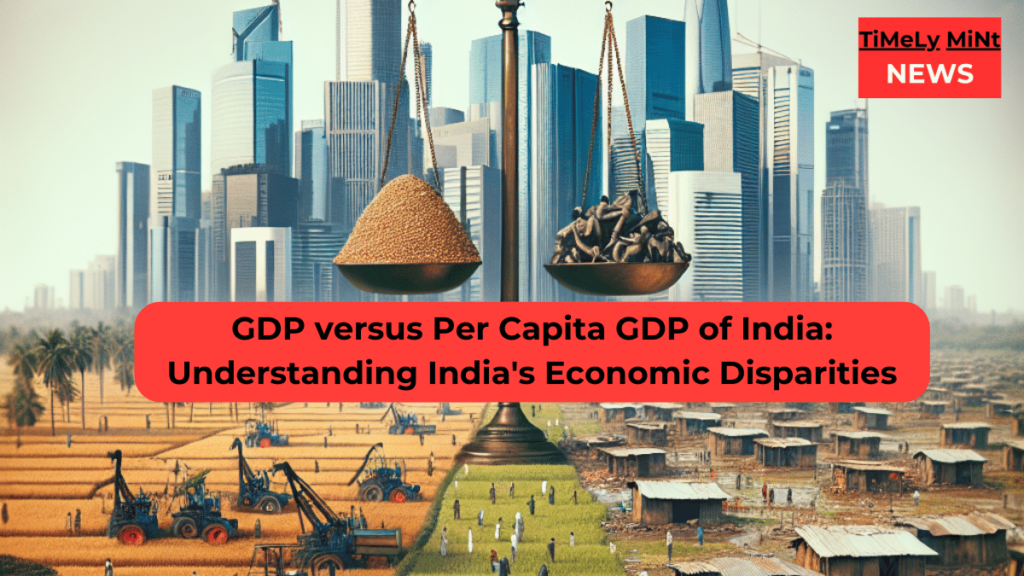
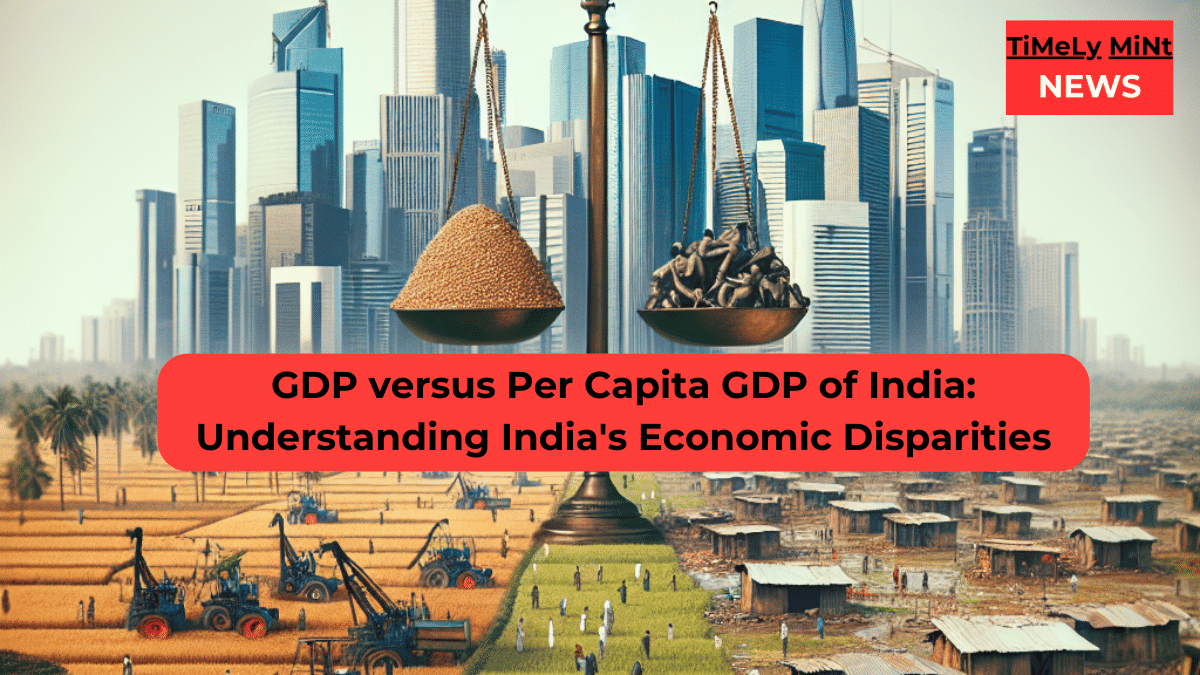
India’s gross domestic product (GDP) is often cited as an indicator of the country’s impressive economic growth and development. However, the headline GDP numbers may not accurately reflect the true economic conditions and standard of living of all Indians. Comparing India’s GDP per capita provides additional insight. This article examines the limitations of GDP in evaluating economic performance, analyzes India’s per capita GDP relative to broader quality of life measures, and discusses more comprehensive methods for assessing India’s development.
Key Takeaways
- India’s GDP growth rate and total GDP size masks low per capita GDP, high inequality and persistent development challenges
- Per capita GDP provides better insight into real income and living standards of average Indians
- Alternative economic indicators like HDI, Gini coefficient and GPI highlight India’s uneven development progress
- Significant regional disparities exist between thriving urban hubs and poorer rural regions
- Policymakers should utilize a combination of economic, social and environmental metrics to formulate equitable, sustainable growth policies
Brief explanation of GDP and per capita GDP
Gross domestic product (GDP) measures the total value of final goods and services produced within a country over a specific time period, typically one year. GDP per capita divides a country’s GDP by its population to estimate the average per person economic production.
Overview of India’s reported GDP and per capita GDP figures
India’s GDP has grown steadily in recent decades. The World Bank reports India’s GDP for 2022 at approximately $3.2 trillion, making it the 5th largest economy globally. However, India’s per capita GDP remains relatively low at around $2,300, ranking India at 150th globally.
Introduction to the debate on whether GDP accurately reflects economic well-being
These figures have sparked debate on whether GDP growth correlates with broader socioeconomic progress and improved living standards across India’s large, diverse population.
Understanding GDP and Per Capita GDP
Definition and calculation of GDP
Gross domestic product (GDP) measures the monetary value of all final goods and services produced by a country over a specific time period, typically one year. Calculating GDP utilizes macroeconomic data on consumption, investments, government expenditure and net exports.
Definition and calculation of per capita GDP
Per capita GDP reflects a country’s GDP divided by its population. Mathematically:
Per Capita GDP = GDP / Population
For example, India’s $3.2 trillion GDP divided by its population of 1.4 billion equals a per capita GDP of approximately $2,300.
The significance of GDP and per capita GDP in economic analysis
GDP serves as a benchmark for determining the size and growth trends of an economy. Per capita GDP estimates the average economic output per person, useful for comparing living standards across nations accounting for population differences.
Limitations of GDP as an Economic Indicator
While GDP provides a snapshot of economic output, it has limitations in evaluating individual prosperity and welfare. Reasons why GDP alone fails to capture India’s actual development include:
The difference between nominal GDP and PPP (Purchasing Power Parity)
Nominal GDP calculations use current market exchange rates that may misrepresent a domestic currency’s actual purchasing power. Purchasing Power Parity (PPP) makes adjustments for price level differences across economies. India’s GDP per capita (PPP) is estimated at $8,000 – more reflective of India’s low domestic costs.
How GDP overlooks income distribution and inequality
India’s national income averages mask extreme income inequality. The top 10% of India’s population holds 77% of the national income while the bottom 50% earns just 13%. High poverty persists despite rising GDP.
| Income Group | Share of National Income |
| Top 10% | 77% |
| Bottom 50% | 13% |
The impact of population size on per capita GDP
A country with a large population like India can post an impressive overall GDP while having a relatively low GDP per capita. Higher population dilutes per person income.
Common criticisms of GDP
GDP also does not account for unpaid labor, informal economies, environmental externalities, or social factors like healthcare access and quality of infrastructure that impact living standards.
India’s Economic Landscape
Overview of India’s economic growth and GDP numbers
India’s GDP has grown on average 6-7% annually over the past decade. The government has touted this GDP growth, projecting India to soon become the world’s third-largest economy.
Analysis of India’s per capita GDP and what it reveals about living standards
However, India’s per capita GDP remains low compared globally, indicating living standards and prosperity shared across India’s large population do not align with the overall GDP figures.
Case studies or examples illustrating the disparity between GDP growth and actual economic conditions
For example, despite strong recent GDP growth, India’s HDI ranking and scores for hunger, nutrition, and gender inequality have not improved proportionately. Rural-urban divides on income, healthcare access, education attainment persist.
| Metric | India Ranking | Issues Highlighted |
| GDP Growth | Top 5 Globally | High absolute GDP |
| GDP Per Capita | 150th Globally | Low income per person |
| Human Development Index (HDI) | 132nd Globally | Poor healthcare, education |
| Global Hunger Index | 107th Globally | High malnutrition, child wasting |
Comparison of India’s per capita GDP with other countries
India’s GDP per capita of $2,300 ranks far below the global average of around $18,000. India’s peers in GDP size like France, UK, Germany show 3-8x higher income per person. Even adjusting for PPP, India ranks low on per capita income globally.
Analysis of regional disparities within India
Additionally, India’s national income averages aggregate wide regional divides. While metro areas like Mumbai are thriving global hubs, states like Bihar, Uttar Pradesh lag severely on income, infrastructure, and social indicators.
Alternative Measures of Economic Well-being
Introduction to alternative economic indicators
Given GDP limitations, economists have developed alternative indicators that better capture national living standards, equality, and sustainability. These include:
- Human Development Index (HDI): Life expectancy, education, GNI per capita
- Gini coefficient: Income distribution equality
- Genuine Progress Indicator (GPI): Accounts for environmental, social factors
- Gross National Happiness (GNH): Holistic well-being measure
Discussion on how these indicators provide a different perspective on India’s economic condition
These metrics paint a less favourable picture of India’s development compared to the GDP growth narrative. India scores poorly on HDI, Gini coefficient highlights extreme income inequality, GPI would likely be deflated by environmental issues and social challenges.
The Role of Income Distribution in Interpreting GDP Numbers
Examination of income inequality in India
As discussed earlier, India’s income is concentrated among the top income strata while lower income groups face high poverty rates, poor social mobility, and lack of financial security.
How income distribution affects the interpretation of per capita GDP
The outsized influence of India’s economic elite skews national income averages like per capita GDP upward while the average Indian household still lives on low incomes, distorting the relationship between per capita GDP and broad living standards.

Policy Implications and the Future of Economic Measurement in India
How policymakers can use a combination of indicators to guide economic decisions
Rather than solely pursuing GDP growth, policymakers should track a range of economic, social, and environmental indicators to formulate balanced, equitable, and sustainable development policies.
The potential for new measures of economic success in India
Alternative index measures can eventually supplement or even replace GDP as primary benchmarks, keeping leaders accountable on more inclusive growth goals.
Conclusion
India’s strong GDP growth makes for positive headlines but per capita GDP, human development metrics, and income inequality reveal a widening disparity between India’s overall economic advancement and the lived experience of average Indians. While GDP has value in macroeconomic analysis, utilizing a variety of indicators that measure equitable, holistic progress will enrich policy discussions on how to best improve incomes, reduce poverty, empower women, and raise living standards across all of Indian society. Tracking these metrics can steer growth strategies towards more inclusive outcomes aligned with the values and priorities of 21st century India.
Data Sources
- World Bank Data on India GDP, GDP per capita metrics (2022)
- UN Human Development Reports (2022)
- World Inequality Database on income distribution (2021)
- Global Hunger Index reports (2021)
- IMF World Economic Outlook on GDP growth projections (2022)
Frequently Asked Questions
What is India’s GDP per capita?
India’s GDP per capita is around $2,300, which ranks India 150th globally, far below the world average of ~$18,000. This indicates low average income and living standards.
Why doesn’t India’s reported GDP reflect the reality for most Indians?
While India’s total GDP seems high, this aggregate figure masks extreme income inequality, low per capita GDP, persistent poverty and poor development indicators across health, hunger, infrastructure etc.
How does India’s development compare regionally?
India lags behind peers like China, Indonesia and Philippines on per capita GDP. South Asian neighbors like Bangladesh have overtaken India on some social indicators despite lower GDP.
Which Indian states have the highest vs. lowest per capita GDP?
More developed states like Maharashtra, Haryana and Karnataka record far higher average incomes. Poorer states like Bihar, Uttar Pradesh, Madhya Pradesh skew India’s overall per capita GDP down.
What metrics better capture India’s living standards?
The HDI, Gini coefficient, Global Hunger Index, gender inequality metrics, financial inclusion levels provide greater insight into real income, equality, access to healthcare and education.
How can India achieve more inclusive growth?
Policy reforms focused on income redistribution, poverty alleviation, healthcare access, education, skill development, women empowerment are vital alongside GDP growth.
Is India’s GDP growth sustainable long-term?
While rapid growth continues, risks around growing inequality, environmental impact, water scarcity etc. threaten long-term, equitable development.
Which sectors drive India’s GDP growth?
Services account for over 50% of GDP. Other major sectors include manufacturing, agriculture, construction, mining and utilities.
What is the outlook for India’s future GDP growth?
Pre-COVID, India projected over 7% annual GDP growth on rising consumption and investment. Post-COVID reopening reaccelerated growth to estimated 6-7% range near-term.
What policy reforms can balance India’s growth?
Investing in healthcare, education and infrastructure across rural India, creating more social security programs, implementing climate-conscious policies for sustainability.


